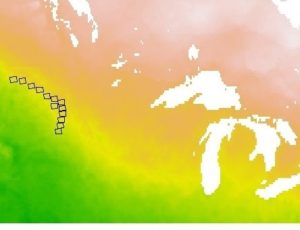
I can’t be thankful enough for my godsend Twitter friend/NetCDF guru Michael Sumner for coming in clutch to rectify this problematic file! As I take my baby steps in learning how to deal with NetCDF files (~3 weeks after being thrown into the “deep end” and trying to tread water), I realized that one of our files had some sort of problem. Relevant to this issue, NetCDF files are often (not always) multidimensional arrays, where 2 of the dimensions are coordinates. The variables can be defined in relation to the dimensions of the file. So for instance, in my case, temperature is described over space and time (4-dimensional array), and each temperature value corresponds to a location and time. So, each temperature value “goes along with” a set of coordinates and a time. When I imported the NetCDF file as a raster brick (which means I put the array data into a stack of grids), the metadata seemed to show a larger longitudinal “step” than latitudinal, the latter of which was at the correct resolution. Note that this means, as is common, I took what is really a point (a temperature value corresponding to a latitude, longitude and time) and turned it into a grid, where the original point is the center of the resulting cell that gets the value. I tried plotting it to see what it looked like.
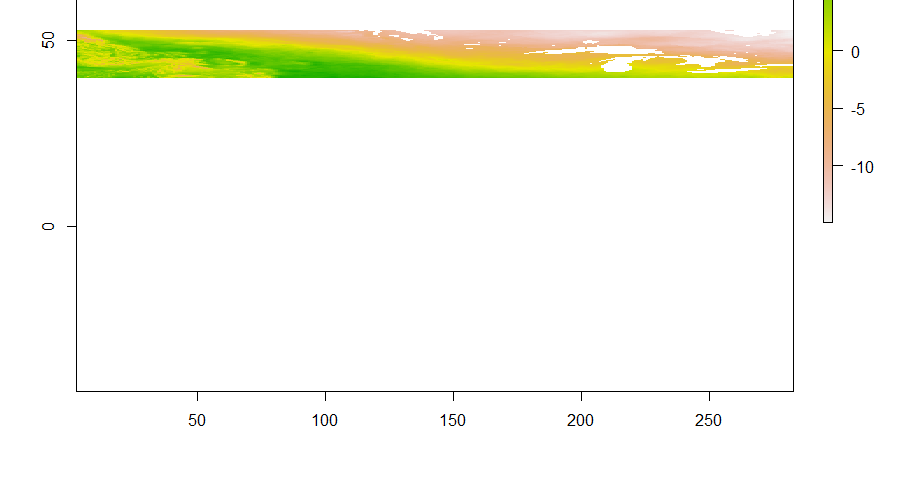
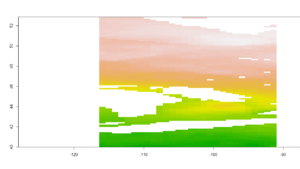
I tried to crop the image to only the extent I needed but it still was messed up.
I took this at face value, that perhaps the grid was somehow “wrong,” but my new friend showed me how to look more deeply into the problem! He opened the file in R and extracted the coordinate values, plotting for a visual diagnosis of the problem.
library(ncdf4) con <- ncdf4::nc_open("file.nc")
lon <- ncdf4::ncvar_get(con, "lon")
lat <- ncdf4::ncvar_get(con, "lat")
ncdf4::nc_close(con)
So, my friend suggested plotting the longitude values stored in this dimension of the array.
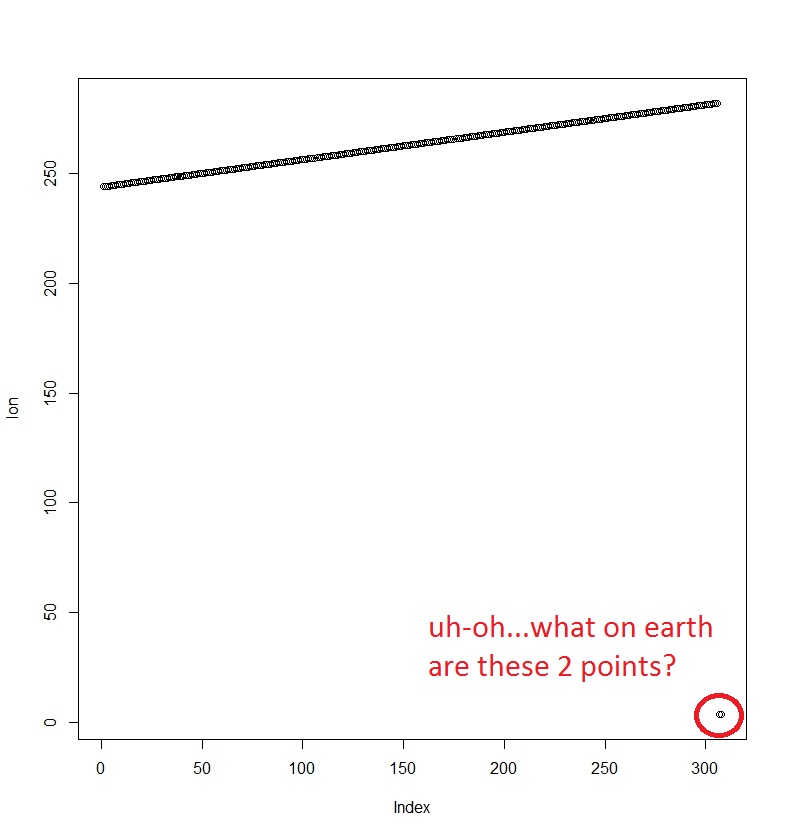
Herein we start to see a problem! Something is off about the longitudes stored in the array.
head(lon)
# [1] 244.0625 244.1875 244.3125 244.4375 244.5625 244.6875
tail(lon)
# [1] 281.8125 281.9375 282.0625 282.1875 3.5200 3.5100
r <- raster::brick(f, stopIfNotEqualSpaced = FALSE)
extent(r)
# class : Extent
# xmin : 3.056128
# xmax : 282.6414
# ymin : 40
# ymax : 52.875
## let's treat it as if the start is correct,
## the final two columns are incorrect
## we hard-code the half-cell left and right cell edge
## (but note the "centre" might not
## be the right interpretation from this model, if we're being exacting)
valid_lon2 <- c(lon[1] - 0.125/2) + c(0, length(lon)) * 0.125
valid_lat <- range(lat) + c(-1, 1) * 0.125/2
r2 <- setExtent(r, extent(valid_lon2, valid_lat))
r_final <- raster::shift(r2, x = -360)